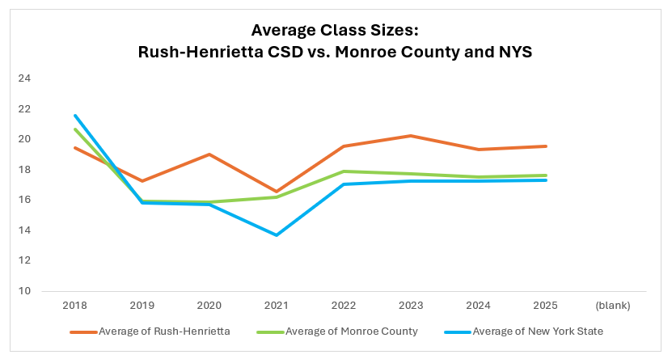
Average Class Sizes: Rush-Henrietta compared to Monroe County and New York State
Introduction
In a diverse community like Rush-Henrietta, every student deserves a fair shot at success. As we work toward equity for all students, class size is not just a number on a chart; it’s a key lever for delivering the support needed by students to thrive.
Since 2011, the Rush-Henrietta Central School District has placed a heavy emphasis on maintaining small class sizes at the primary level. This policy was informed by decades of research which show that smaller classes make a big difference,
In particular, low class sizes have been demonstrated to better support low-income and minority students.. Major studies, like Tennessee’s Project STAR, prove that fewer students per classroom help close learning gaps and boost achievement where it matters most.
Class sizes also shape daily life for teachers. When classes are smaller, our educators have more time for each child, increasing their impact on the outcomes they are trying to achieve for their students – academically, emotionally, and socially.
Decisions about class sizes have strong implications for our District’s ability to achieve its strategic objectives:
- Specifically – under “Excellence for Every Student”, the District aims to “promote access and inclusion for each student” with a specific target of decreasing the achievement gap between student subgroups on state assessments”.
- Foundationally – none of the District’s objectives can be met without retaining teachers, and lower class sizes are one of the factors that our teachers union (RHEA) has highlighted as a major consideration for teachers.
For this reason, Rush-Henrietta Parents for Change (RHPFC) has developed this report on average class sizes. It looks at eight years of state data (2018–2025) to illustrate the historical class sizes maintained in the District by grade level. Our goal is to provide context for decisions that put fairness and learning first for every student in Rush-Henrietta.
What the Data Highlights
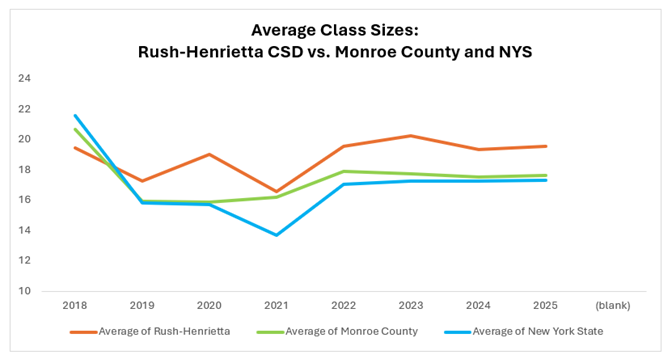
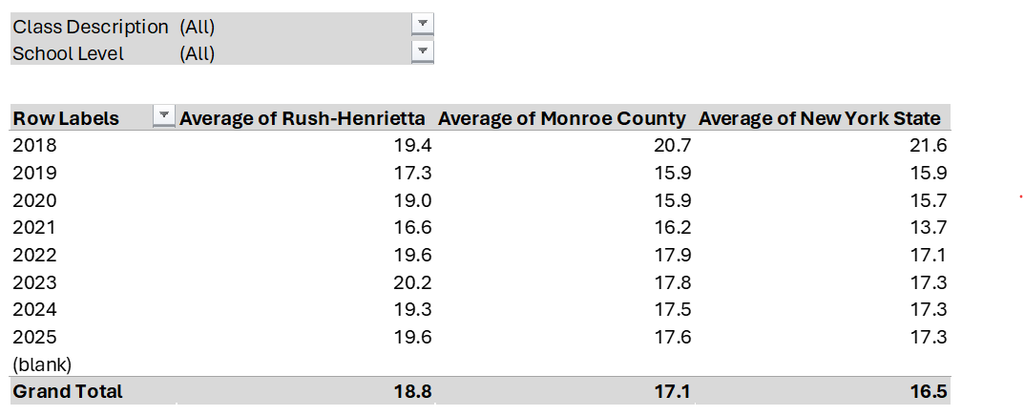
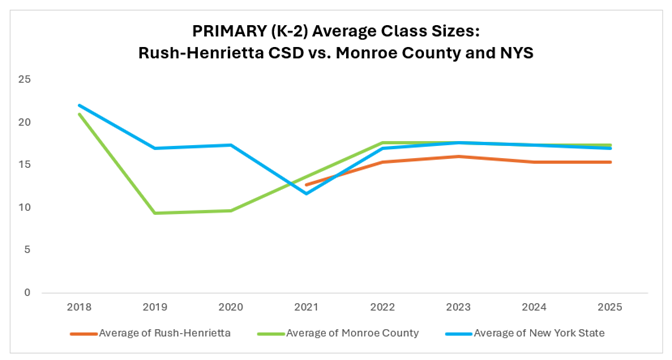
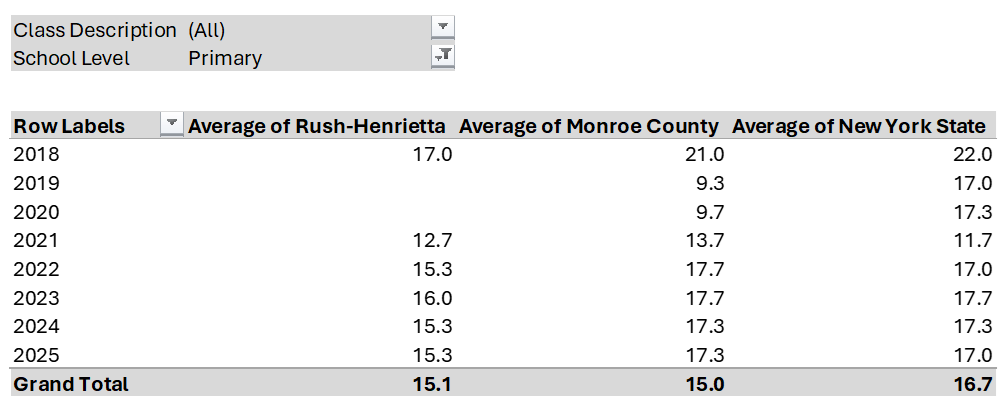
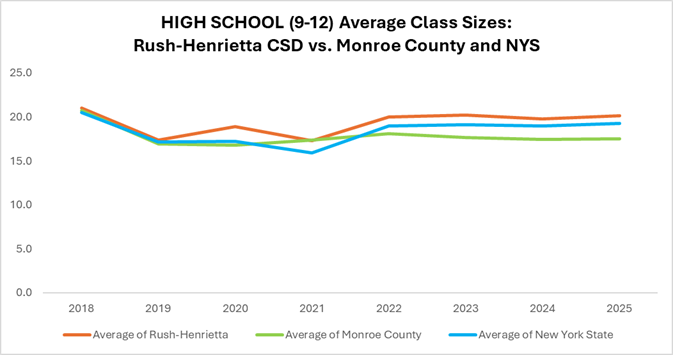
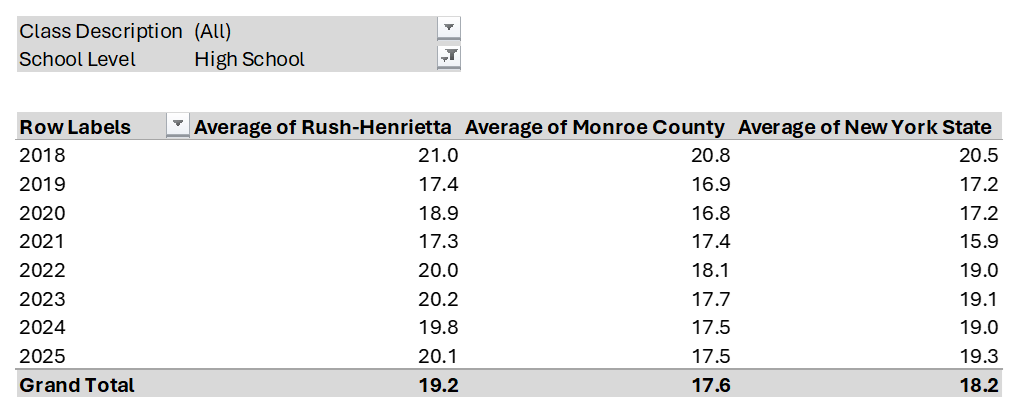
From 2018-2025, average class sizes have maintained a relatively stable margin between RHCSD, Monroe County and New York State – reflecting a clear policy and sustained commitment on the District’s behalf to ensure targeted support for Primary students through smaller class sizes.
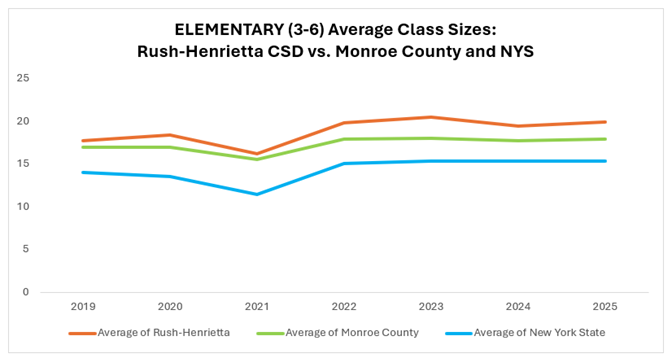
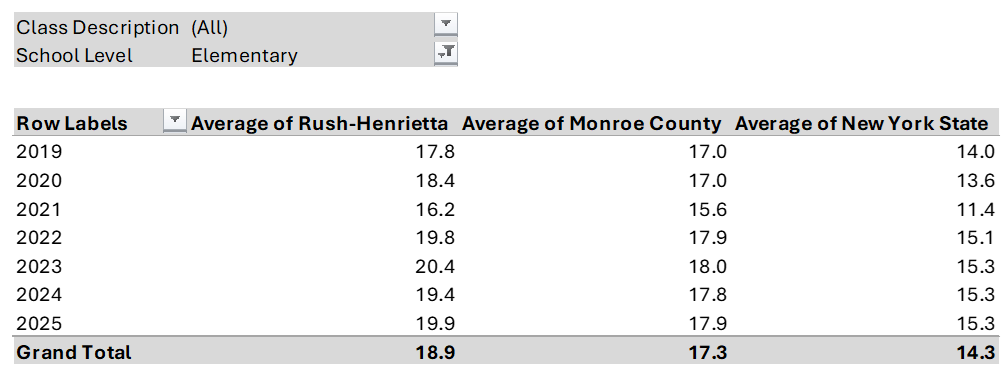
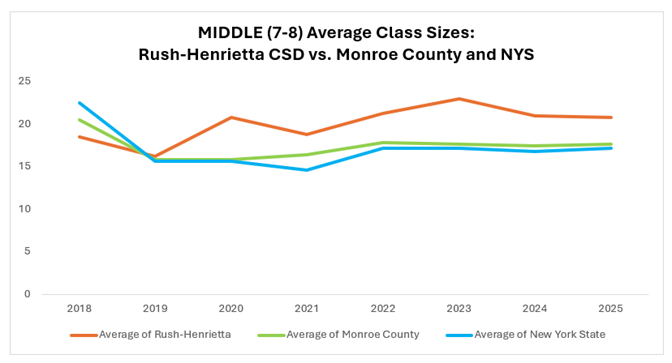
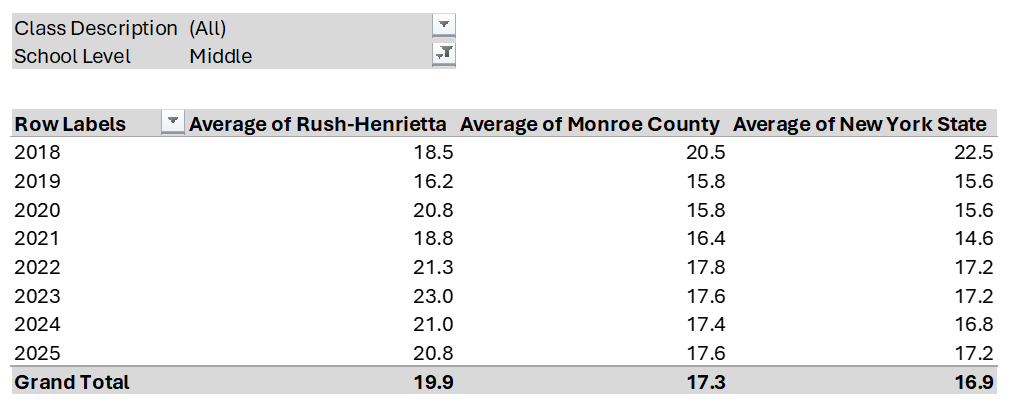
At the same time, our Elementary and Middle school class sizes have been consistently and materially larger than those of the schools we are benchmarking against.
As the District actively seeks to improve academic attainment for important subgroups within our community – specifically low-income and minority students – the larger class sizes documented within Elementary and Middle school at RHCSD represent a clear opportunity to adopt the recommendations of RHEA to reduce class sizes beyond Primary school.
Average Class Size Data, by School Category / Grade Level
Data, methodology, and interpretation
Data used
The analysis uses NYSED average-class-size data for reporting years 2018–2025 (school years 2017–18 through 2024–25). This data is made available to the public on the NYSED website, published under each Report Card in the “Student and Educator Report” section. We extracted this data from each District report card in Monroe county using the URL format: https://data.nysed.gov/studenteducator.php?year=YYYY&instid=EEEEEEEEEEEE replacing YYYY with year and EEEEEEEEEEEE with actual entity code.
Entity codes are as follows:
| DISTRICT | ENTITY CODE |
| BRIGHTON CENTRAL SCHOOL DISTRICT | 260101060000 |
| BROCKPORT CENTRAL SCHOOL DISTRICT | 261801060000 |
| CHURCHVILLE-CHILI CENTRAL SCHOOL DISTRICT | 261501060000 |
| EAST IRONDEQUOIT CENTRAL SCHOOL DISTRICT | 260801060000 |
| EAST ROCHESTER UNION FREE SCHOOL DISTRICT | 261313030000 |
| FAIRPORT CENTRAL SCHOOL DISTRICT | 261301060000 |
| GATES-CHILI CENTRAL SCHOOL DISTRICT | 260401060000 |
| GREECE CENTRAL SCHOOL DISTRICT | 260501060000 |
| HILTON CENTRAL SCHOOL DISTRICT | 261101060000 |
| HONEOYE | 260901060000 |
| HONEOYE FALLS-LIMA CENTRAL SCHOOL DISTRICT | 260901060000 |
| PENFIELD CENTRAL SCHOOL DISTRICT | 261201060000 |
| PITTSFORD CENTRAL SCHOOL DISTRICT | 261401060000 |
| ROCHESTER CITY SCHOOL DISTRICT | 261600010000 |
| RUSH-HENRIETTA CENTRAL SCHOOL DISTRICT | 261701060000 |
| SPENCERPORT CENTRAL SCHOOL DISTRICT | 261001060000 |
| WEBSTER CENTRAL SCHOOL DISTRICT | 261901060000 |
| WEST IRONDEQUOIT CENTRAL SCHOOL DISTRICT | 260803060000 |
| WHEATLAND-CHILI CENTRAL SCHOOL DISTRICT | 262001040000 |
The figures shown in the charts and tables are averages of the available reported class-size measures for Rush-Henrietta, Monroe County, and New York State, grouped by reporting year and school level. Primary covers K–2; Elementary, grades 3–6; Middle, grades 7–8; and High School, grades 9–12, as labeled in the report.
These summary values are averages of reported measures, not necessarily student-weighted averages of all classrooms. The Monroe County and NYS figures are comparison benchmarks, not estimates of a typical individual classroom.
Limitations of the Data
The published figures summarize reported class-size categories and should not be interpreted as the size of every classroom or as a student-weighted districtwide mean. The number and mix of reported categories can differ by year and geography, affecting comparisons. In particular, Rush-Henrietta primary values are missing for 2018–19 and 2019–20, and 2017–18 uses categories that are not fully comparable with later years. Pandemic-era scheduling and reporting changes may also affect the series.
These data do not establish why class sizes differ. Enrollment changes, staffing allocations, course offerings, and reporting practices could all contribute. Further analysis using enrollment and classroom counts would be needed to determine the share of students experiencing larger classes.