Staffing in Rush-Henrietta: How Do Our Allocations Compare to Other Districts in Monroe County and New York State?
Introduction
Teachers are the foundation of a successful education system. While teaching assistants, aides, and other support staff play key roles in meeting students’ needs, they cannot replace the expertise, training, and instructional leadership of certified teachers.
As RHCSD works to improve student outcomes, particularly for students who need additional support, decisions on how we allocate staffing resources matter. The balance between classroom teachers and paraprofessionals has implications for instructional quality, class sizes, teacher workload, and the District’s ability to deliver “Excellence for Every Student”.
For this reason, Rush-Henrietta Parents for Change (RHPFC) has reviewed and consolidated nine years of NYSED staffing data (2016–2025), comparing staffing levels per 1,000 students in Rush-Henrietta with Monroe County and New York State.
Our goal is to better understand how the District’s staffing priorities are evolving and whether those decisions are aligned with the needs of our students and teachers.
What the Data Highlights
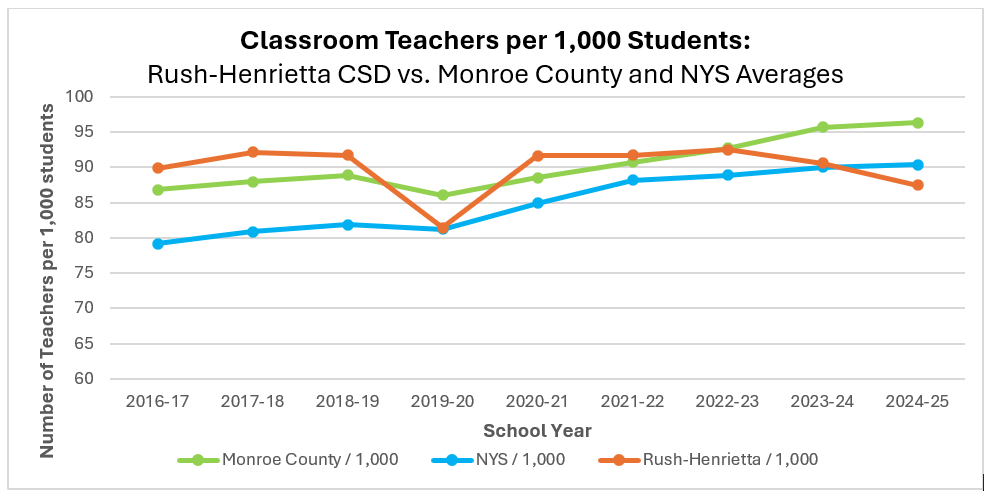
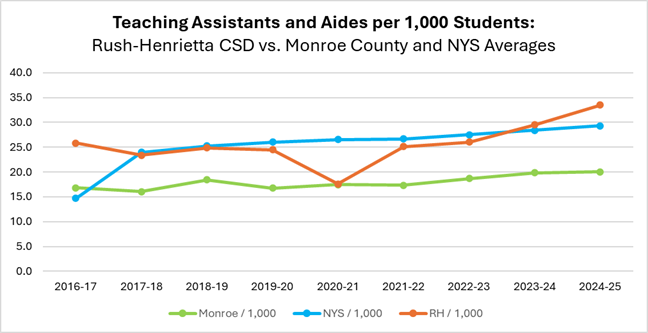
In recent years, Rush-Henrietta has reduced the number of classroom teachers per 1,000 students while increasing its reliance on teaching assistants and aides. This shift stands in contrast to Monroe County and New York State, where classroom teacher staffing levels have increased.
These trends raise important questions about the District’s staffing strategy. Is this an intentional shift toward a lower-cost staffing model, or the result of challenges recruiting and retaining certified teachers? Are paraprofessionals increasingly being asked to fill gaps traditionally addressed by classroom teachers?
Most importantly, is this approach delivering the educational support our students need?
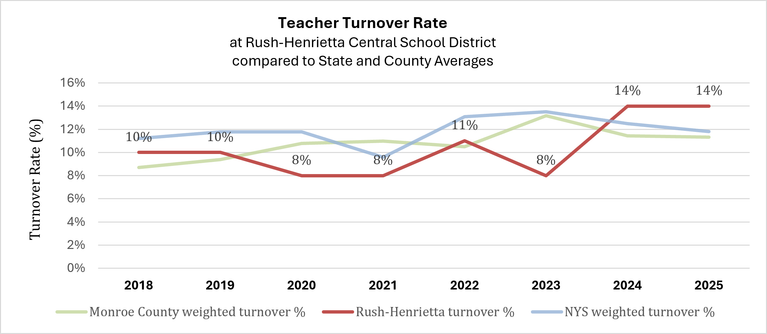
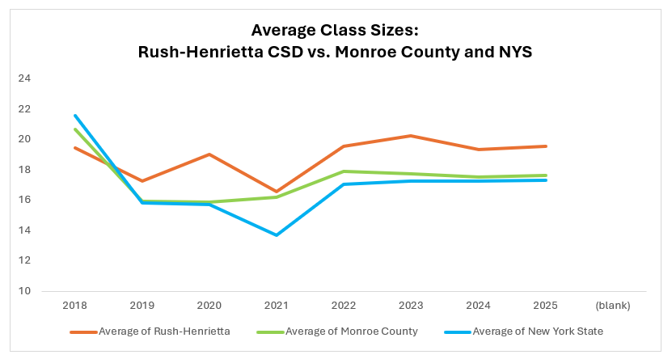
Our recent analyses of teacher turnover and class sizes suggest reasons for concern. As the District works to close achievement gaps and improve student outcomes, we believe the community deserves greater visibility into how staffing decisions are made, what outcomes they are intended to achieve, and how their effectiveness is being evaluated.
Data, methodology, and interpretation
Data used
This analysis uses NYSED Personnel Master Files for the school years 2016–17 through 2024–25, sourced at https://www.nysed.gov/information-reporting-services/personnel-master-file-pmf . Staffing is measured as full-time-equivalent (FTE) positions per 1,000 K–12 students, calculated as the sum of reported FTE divided by covered K–12 enrollment, multiplied by 1,000. The Monroe County benchmark pools 18 public school districts, including Rush-Henrietta and Rochester City; the NYS benchmark pools reporting public school districts statewide. Both benchmarks are enrollment-weighted rather than simple averages of district rates. Categories include classroom teachers, teaching assistants and aides, and other paraprofessionals; the latter two comprise total paraprofessionals. Because the workbook reports staffing categories rather than individual duties, the analysis cannot determine how particular staff members are deployed.
What the results suggest:
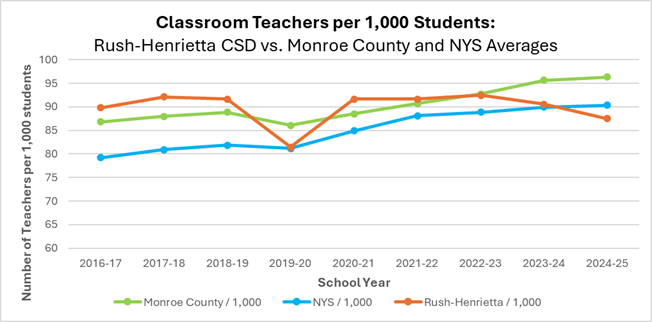
- A recent decline in classroom-teacher coverage. Rush-Henrietta reported 92.4 classroom-teacher FTE per 1,000 students in 2022–23, 90.6 in 2023–24, and 87.5 in 2024–25. Its reported classroom-teacher FTE declined from 501.2 to 483.2 over those two years. The 2024–25 rate was 8.9 below the Monroe County benchmark (96.3) and 2.9 below NYS (90.4). The comparison is especially notable because both benchmarks rose during this period.
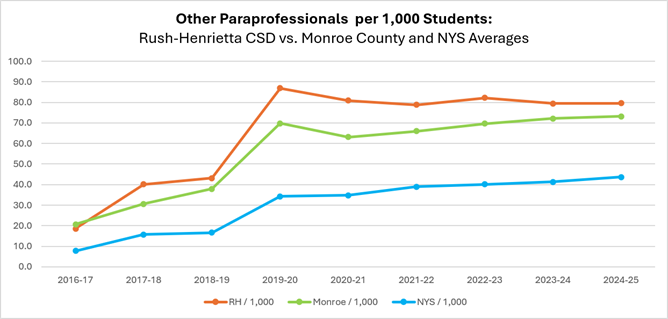
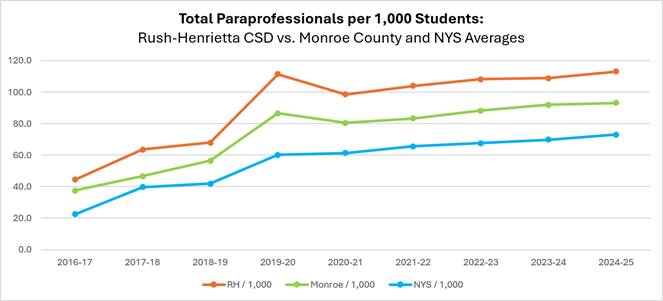
- Increasing use of teaching assistants and aides. Rush-Henrietta’s teaching assistants and aides increased from 141.0 FTE (26.0 per 1,000 students) in 2022–23 to 185.0 FTE (33.5 per 1,000) in 2024–25. Total paraprofessional staffing rose from 586.4 to 624.5 FTE, or from 108.2 to 113.1 per 1,000 students. The increase in assistants and aides was partly offset by a decrease in other paraprofessionals, from 82.2 to 79.6 per 1,000. Thus, the strongest evidence of expansion concerns assistants and aides, rather than uniform growth across all support categories.
- A change in staffing mix, whether intentional or inadvertent. Employing paraprofessionals can expand student support, but they have different preparation, responsibilities, and permissible roles from certified classroom teachers. The simultaneous decline in teacher coverage and rise in assistants and aides is consistent with a shift in staffing mix; it does not prove that one position type was substituted for another or identify the district’s rationale.
- Implications for student support. The companion class-size report documents larger reported elementary and middle school classes in Rush-Henrietta than in Monroe County and NYS. Taken together, these patterns justify examining whether staffing allocations provide sufficient certified instructional capacity and how paraprofessional roles are supervised and deployed. The available datasets do not establish that the staffing shift caused the class-size differences or that student outcomes have worsened because of it.
Limitations of the Data
The figures represent reported FTE, not headcounts, individual classroom assignments, staff qualifications, or the amount of direct instruction received by students. K–12 enrollment is used as a common denominator across all staffing categories; it does not account for differences in student needs, special education placements, program offerings, or school configuration.
Paraprofessional categories may include roles that are not interchangeable with classroom teaching. Reporting definitions and completeness may vary over time; the sharp change in some paraprofessional series around 2019–20 warrants particular caution in long-run comparisons. Monroe County and NYS benchmarks include Rush-Henrietta.
These descriptive trends do not establish staffing intent, cost savings, substitution, instructional quality, or causation. To evaluate the policy and its effects, the district should disclose staffing budgets and vacancies by role, assignment and caseload data, class counts, paraprofessional duties, and student outcome measures.