Teacher Turnover in the Rush-Henrietta Central School District
Introduction
Great teachers are at the heart of a successful school district. When experienced educators stay, they build stronger relationships with students and families, understand individual learning needs, and contribute to a stable, supportive school environment.
Teacher retention is particularly important as Rush-Henrietta works to close achievement gaps and improve student outcomes. High turnover can disrupt learning, increase the workload of remaining teachers, and make it harder to sustain progress.
While some turnover is inevitable, school districts play an important role in creating conditions that encourage talented educators to stay.
For this reason, Rush-Henrietta Parents for Change (RHPFC) has examined eight years of NYSED teacher turnover data (2017–2018 through 2024-2025), comparing Rush-Henrietta with Monroe County and New York State.
Our goal is to understand how the District’s teacher retention compares with its peers and whether more can be done to support a stable, effective teaching workforce.
What the Data Highlights
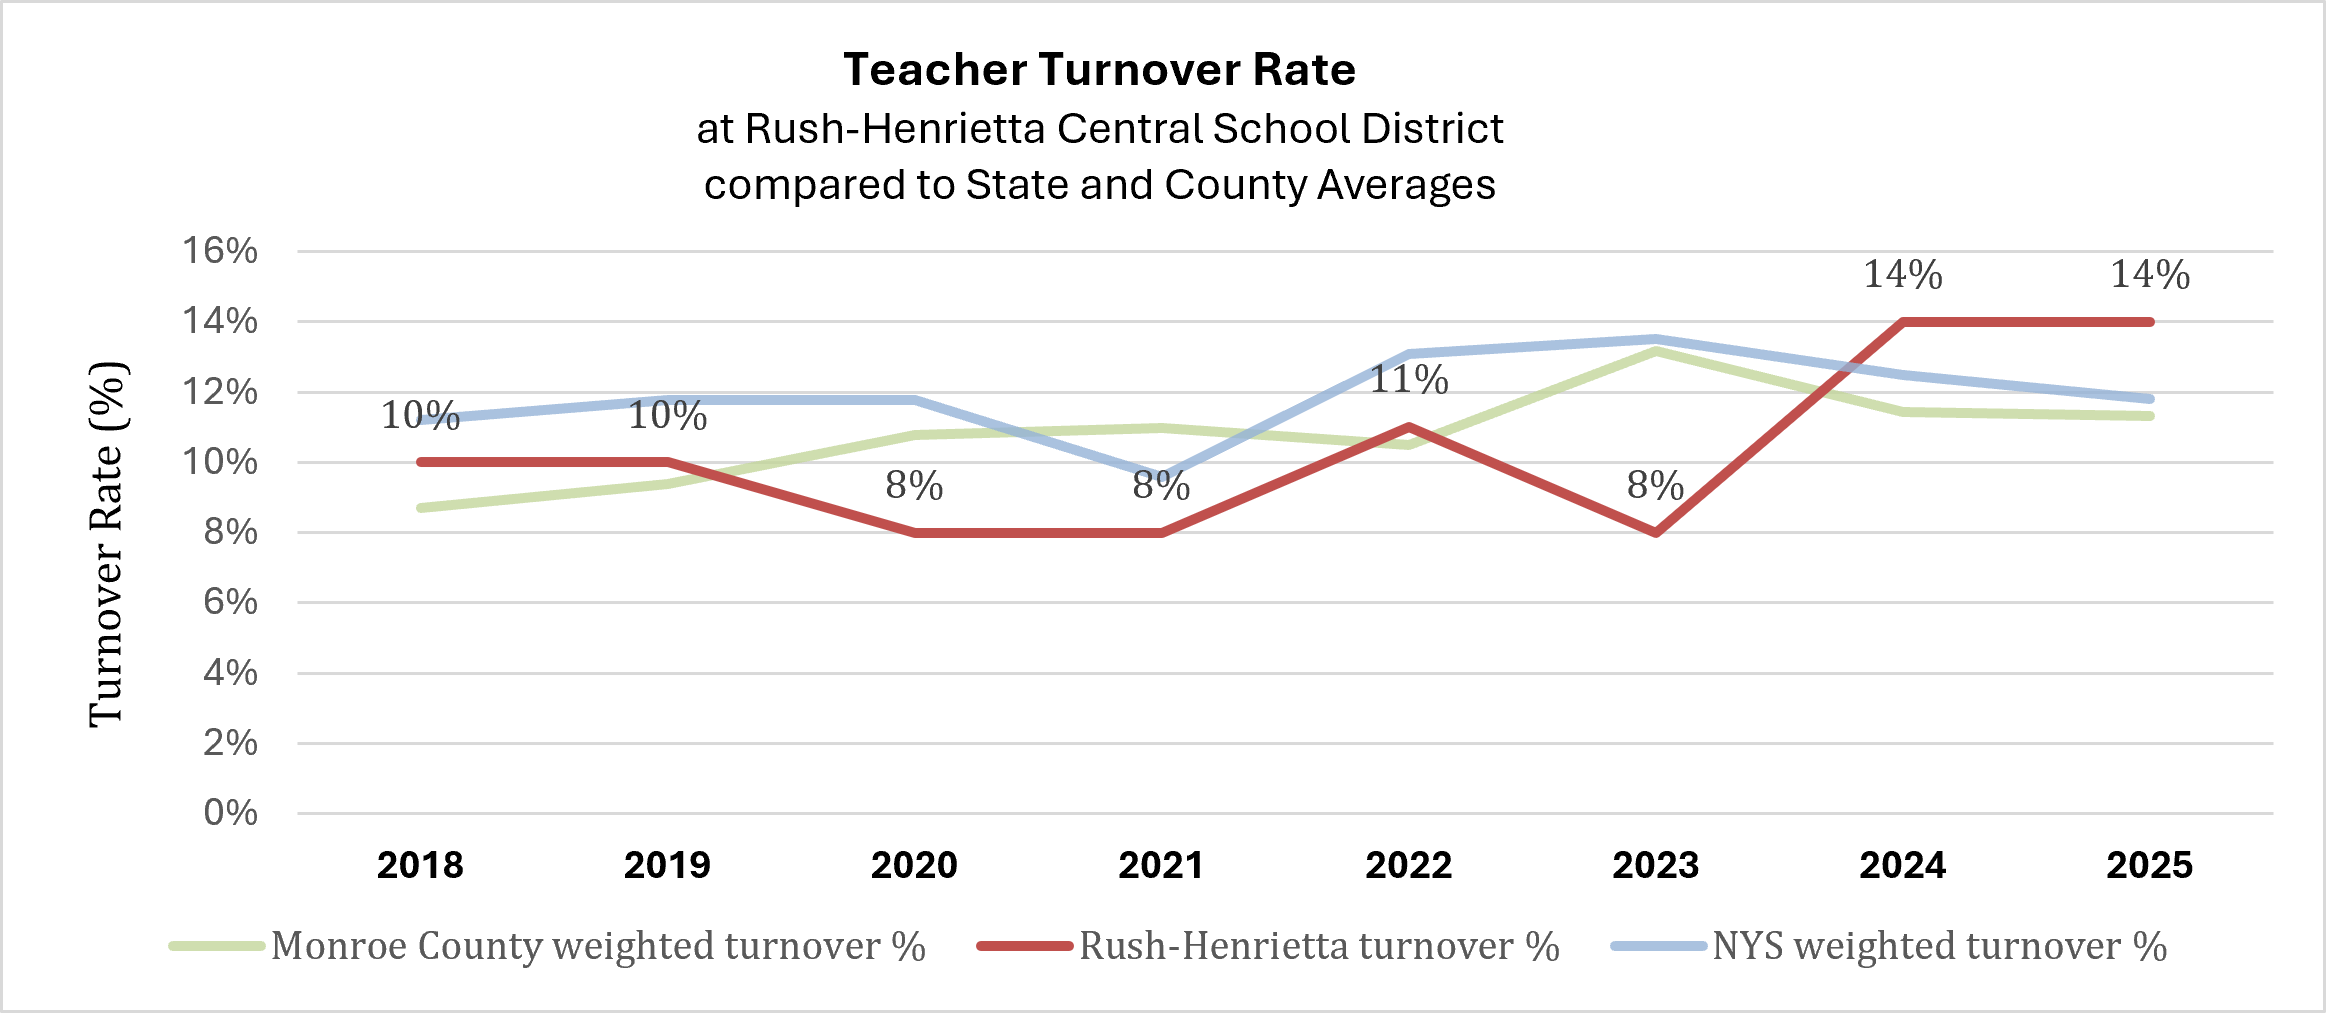
After several years of relatively low turnover, Rush-Henrietta’s teacher turnover rate rose sharply to 14% in 2023–24 and remained there in 2024–25. This increase is noteworthy in comparison to average turnover rates across Monroe County and New York State, where turnover declined over the same period.
These trends raise important questions. What has changed within the District? Are teachers leaving because of working conditions, leadership, workload, or other factors? Is attrition due to teacher retirements, or voluntary departures? Are retirements occurring at a typical point of tenure, or these premature relative to historical averages?
Most importantly, what is the District doing to understand why teachers leave and create conditions that encourage them to stay?
As Rush-Henrietta works to improve student outcomes, the community deserves greater visibility into the factors driving teacher turnover and the effectiveness of the District’s retention efforts.
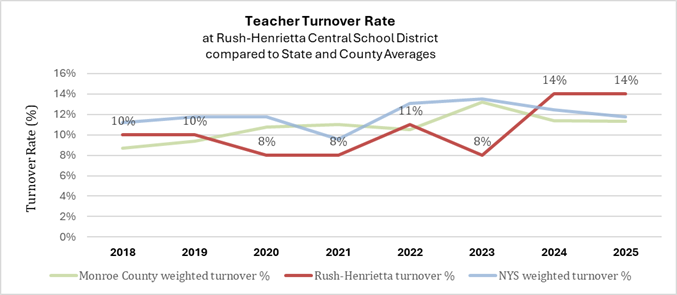
Published district turnover rates and calculated teacher-headcount-weighted benchmarks.
Reporting year shown as school year. Source: NYSED Staff table exports, 2018–2025.
Eight-year comparison of Turnover Rates
| School year | Rush-Henrietta | Monroe County Weighted | NYS Weighted | Monroe County Unweighted | NYS Unweighted |
| 2017–18 | 10% | 8.70% | 11.21% | 7.50% | 9.58% |
| 2018–19 | 10% | 9.38% | 11.77% | 9.39% | 11.03% |
| 2019–20 | 8% | 10.79% | 11.76% | 9.94% | 10.59% |
| 2020–21 | 8% | 10.99% | 9.57% | 9.56% | 9.80% |
| 2021–22 | 11% | 10.49% | 13.07% | 11.17% | 12.60% |
| 2022–23 | 8% | 13.18% | 13.51% | 13.06% | 12.82% |
| 2023–24 | 14% | 11.42% | 12.48% | 11.50% | 11.81% |
| 2024–25 | 14% | 11.31% | 11.79% | 12.00% | 11.72% |
Data, methodology, and interpretation
Data used and population
This analysis consolidates data from NYSED Student and Educator databases, acquired on the NYSED School Report Card “Downloads” page at https://data.nysed.gov/downloads.php
For each school year from 2018-2019 through 2024-2025, we extracted Teacher Turnover data from the Staff tables in each database. We selected district-level records using NYSED district/entity codes, excluding school-level records to avoid double-counting.
The Monroe County comparison covers 18 public school districts in every year (144 district-year observations), including Rochester City School District. The statewide benchmark uses available district-level records with positive teacher counts and reported turnover rates (718 qualifying districts in 2025).
Key source fields: NUM_TEACH (teacher headcount), PER_TURN_A (overall teacher turnover percentage), and PER_TURN_FI (turnover among teachers with fewer than five years of experience). Staff counts for principals, counselors, and social workers and teacher attendance were also retained in the accompanying workbook. A value of 14 in PER_TURN_A means 14%, not 0.14%.
How the benchmarks are weighted
For each year, the teacher-weighted turnover benchmark equals the sum of each included district’s teacher headcount multiplied by its reported turnover percentage, divided by the sum of those teacher headcounts:
Weighted turnover (%) = Σ [district teacher count × district turnover (%)] ÷ Σ [district teacher count]
This gives larger districts greater influence. For example, a 500-teacher district at 15% turnover and a 100-teacher district at 5% turnover produce a weighted average of 13.33%, versus a simple district average of 10%. We calculate separate benchmarks for Monroe County and statewide; blank turnover values and zero-teacher records are excluded.
The unweighted mean (each district counts equally) is also supplied in the workbook. These averages paint a less favorable picture for Rush-Henrietta, so we chose to present a more conservative basis for benchmarking our RHCSD turnover rates.
What the results suggest
1. A recent divergence: In 2022–23, Rush-Henrietta’s 8% rate was 5.18 points below the county weighted benchmark. In 2024–25, its 14% rate was 2.69 points above it—an approximately 7.87-point reversal in relative position across two reporting years.
2. The rise is not explained by a uniform regional increase: Between 2022–23 and 2024–25, Rush-Henrietta increased from 8% to 14%, while the Monroe County weighted benchmark declined from 13.18% to 11.31%. This warrants investigation of district-specific conditions, but does not establish a cause.
3. Early-career turnover merits separate review: Rush-Henrietta’s reported early-career turnover was 30% in 2023–24 and 15% in 2024–25.
Limitations of the Data
NYSED’s published turnover percentages are rounded. Weighting by the report-year teacher count approximates a pooled rate; it may not match NYSED’s underlying turnover denominator. Teacher turnover does not distinguish retirements, resignations, transfers to other districts, or reasons for departure. The principal field is a headcount, not an administrator-turnover rate.